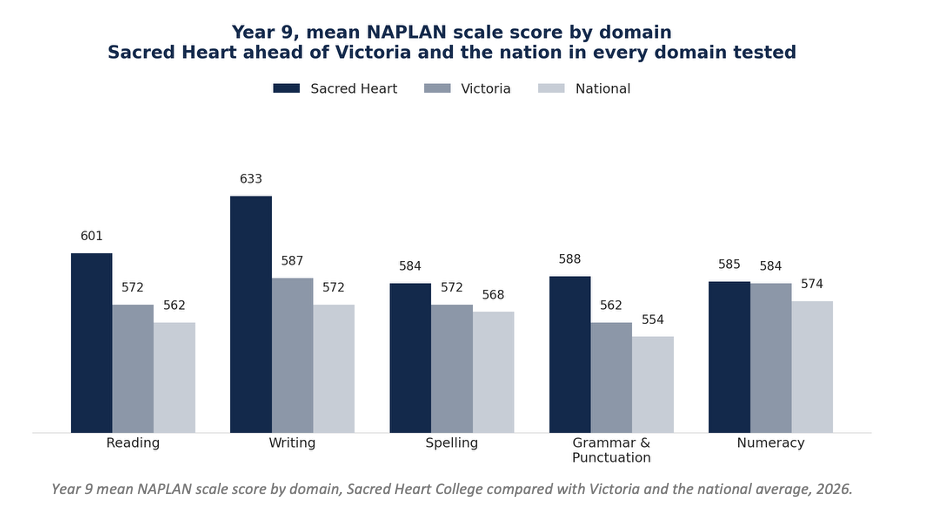
Every year, NAPLAN gives us a consistent measure of how our students are tracking against every other student in the country. The 2026 results are in, and they are worth sharing. Victoria is one of the stronger performing states in the country on NAPLAN, so the state average is already a high bar. Our Year 9 students have outperformed both the Victorian and national averages in reading, writing, spelling, grammar and punctuation, and numeracy, in every domain tested.
This is not a single strong cohort carrying the average. It is a consistent pattern across five learning areas. It also sits alongside one of the more telling findings in this year's data. An unusually small proportion of our students fall into the needs additional support (NAS) category, which means the gains are broad based, not concentrated in a handful of high performers.
Reading is where the gap was widest. Our Year 9 students averaged 601 on the NAPLAN reading scale, ahead of the Victorian average of 572 and the national average of 562. 86% of our Year 9 students sat in the top two proficiency bands, Strong or Exceeding, compared with 66% across the state and 62% nationally.
Writing was our strongest result of all. Year 9 students averaged 633, 46 points above the state average and 61 points above the national average, with almost nine in ten students, 89%, achieving a Strong or Exceeding result.
Numeracy is also a strength. Our Year 9 average of 585 sits ahead of the national average of 574, and just ahead of Victoria's own average of 584. 80% of our Year 9 cohort achieved Strong or Exceeding, compared with 69% across the state and 65% nationally.
Year 7 results follow the same pattern, ahead of both the state and national averages in every domain tested.
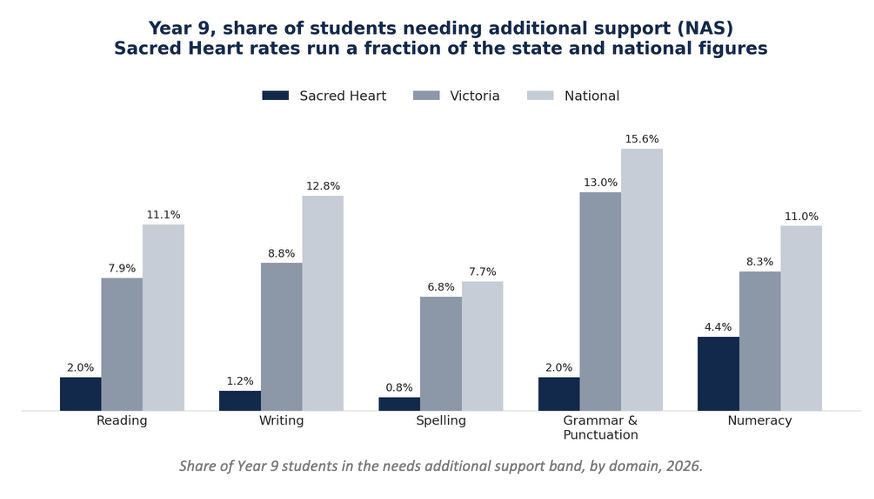
The number that matters most this year is probably the one that gets talked about least, the proportion of students in the needs additional support, or NAS, band. Across every domain, our Year 9 NAS rates sat well below state and national figures, in most cases by a factor of four or more. In writing, just 1.2% of our students were in the NAS band, against 8.8% statewide and 12.8% nationally. In spelling it was 0.8%, against 6.8% and 7.7%. Our results are not being driven by a small group of high achievers. They reflect broad based teaching and learning that is reaching virtually every student in the cohort.
These results did not happen by accident. They reflect four deliberate features of how we teach at Sacred Heart, particularly across the McAuley years.
First, dedicated literacy and numeracy intervention runs across Years 7, 8 and 9, identifying students who need additional support early and giving them targeted, small group teaching to close gaps before they widen. It is a direct driver of the NAS figures above. When a gap is caught and addressed in Year 7, it rarely still shows up by Year 9.
Second, our pedagogical model is built on Tom Sherrington's Learning Rainforest, where explicit instruction and inquiry work together instead of competing. Teachers directly teach the core knowledge, vocabulary and skills every student needs, then build in structured opportunities for inquiry, so students are applying and extending what they have learnt instead of meeting ideas with no foundation to make sense of them. It fits naturally with our IB Middle Years Programme (MYP) philosophy, which is itself built on structured inquiry into concepts and big ideas, not open ended discovery for its own sake. Explicit instruction gives our MYP students the knowledge base that makes that inquiry effective.
Third, our timetable gives each subject the room to teach in the way that discipline actually needs, instead of fitting everything into an identical block. Increasing the time allocated to literacy and numeracy was a deliberate element when the timetable was architected, giving teachers more sustained contact time in these areas rather than fitting them around everything else. That flexibility also protects the sustained, focused teaching time that explicit instruction and disciplinary inquiry depend on, which a rigid, one-size-fits-all timetable makes difficult to achieve in a modern school day.
Fourth, a school wide reading program was introduced across Years 7 to 10 this year, giving every student protected time to read regularly and building the reading stamina and vocabulary that underpin results across every subject, not only English. It is too early for this year's results to reflect it fully, and it is where we expect to see the benefit build from here.
Results in a single year are only part of the picture. What matters just as much is whether Sacred Heart is improving over time, on its own terms.
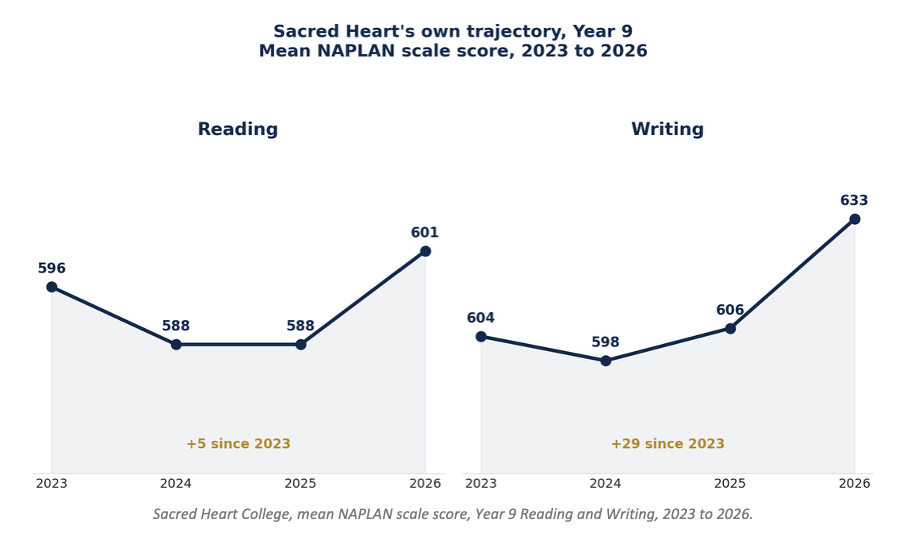
For our current Year 9 cohort, we can now look back across their own journey through the College. Reading has held largely steady across the past four years, easing slightly in 2024 and 2025 before climbing to its highest point yet this year, a net gain of 5 points since 2023. Writing shows the clearer trend, a dip in 2024 followed by two strong years of improvement, lifting 29 points since 2023 to reach this year's result of 633.
These results reflect the effort our students bring to every assessment, and the consistency with which our teachers apply this approach across both the McAuley and Maguire years. They also reflect something central to who we are, a Mercy tradition that asks us to make sure every student, not only the strongest, is supported to reach her potential. This year's data suggests that approach is working.
We are not sharing these results to make a claim about how we compare with every other school in Victoria. NAPLAN data alone cannot tell us that. We are sharing them because the achievement is real. Victoria is a strong state on NAPLAN, and our Year 9 students have still outperformed that state average, and the national average, in every domain tested, while improving in reading and writing year on year. That is worth celebrating with our whole community, our students, staff and families.
Figures are drawn from Sacred Heart College's 2026 NAPLAN School Overview and Five Year Trend reports (National Assessment Program, Literacy and Numeracy). State and national comparisons use the published Victorian and Australian averages for the relevant year level and domain.